
Vizzlo Review 2026: Pricing, Free Trial, Chart Features & Buyer Verdict
Vizzlo is a chart and business graphics tool for people who need clean presentation visuals for reports, client decks, roadmaps, timelines, and team updates without rebuilding charts manually in slides.
Why Trust CandidCodes?
We review SaaS tools from the buyer’s side: pricing clarity, plan limits, trial terms, workflow fit, and whether the tool deserves a place in a real paid stack. For Vizzlo, the key question is simple: does it help users create better presentation charts faster than spreadsheet formatting and manual slide cleanup?
Free, monthly, annual, team, and enterprise pricing are separated clearly instead of being hidden inside one vague “starts at” claim.
Vizzlo has a free plan and free trial in this review. We do not invent coupon codes just to make a CTA button look more dramatic.
The review focuses on real use cases: consulting decks, business reports, roadmaps, timelines, team visuals, and presentation-ready charts.
No exaggerated claims, no income promises, no forced urgency, and no unverified superlatives. The goal is a practical buyer review, not inflated affiliate copy.
Hands-On Testing Notes
For this update, CandidCodes reviewed Vizzlo from a practical buyer workflow angle: pricing clarity, trial positioning, Free plan limitations, Professional and Teams plan fit, chart-library depth, AI chart creation positioning, and whether the tool fits presentation work better than spreadsheet-only chart formatting.
Swipe sideways to review each testing note as full-width cards without squeezed text.
Free, Professional, Teams, and Enterprise are separated clearly, with monthly and annual billing options reviewed for buyer clarity.
The article separates the 14-day free trial from the Free plan, because those are different buyer decisions and should not be blended into one vague offer.
The review focuses on where Vizzlo is strongest: browser-based chart creation, PowerPoint and Google Slides workflows, reports, client decks, timelines, and visual business updates.
Chart Vizzard is reviewed as a first-draft AI chart workflow, not as a replacement for human data checking, chart context, or final slide quality control.
Vizzlo is compared against Canva, Beautiful.ai, spreadsheets, Tableau, and Power BI by use case instead of pretending every visual tool solves the same job.
This review is buyer-focused and editorial. Final pricing, tax, plan limits, and billing terms should still be confirmed on Vizzlo before purchase.
30-Second Verdict
Vizzlo is best for consultants, marketers, analysts, founders, educators, project managers, and teams that turn data into presentation-ready charts. It is especially useful when the final output is a slide deck, proposal, client report, roadmap, timeline, or strategy update.
The strongest reason to try Vizzlo is its focused chart workflow. It gives users many chart and business graphic types, works with PowerPoint and Google Slides, and offers a Free plan for testing. Paid users get better output control, no watermark, and team features depending on the plan.
The main limitation is also clear: Vizzlo is not a full BI dashboard tool. If you need deep analytics systems, look elsewhere. If you need charts that look clean inside business presentations, Vizzlo is much closer to the job.
Best for
- Consultants and agencies building client decks.
- Marketers and analysts creating reporting visuals.
- Founders and teams preparing investor or strategy updates.
- Educators and project managers explaining timelines or processes.
Not ideal for
- Deep BI dashboards with live analytics infrastructure.
- One-off simple charts that do not need presentation polish.
- Broad social graphics, ads, posters, or general brand design.
- Teams that already have a strict enterprise dashboard stack.
Vizzlo helps turn chart data into clean business graphics for presentations, reports, and team decks.
Vizzlo Pricing & Plans
Vizzlo has a Free plan, Professional, Teams, and Enterprise. The Free plan is useful for testing but includes a watermark. Professional is the cleanest fit for solo users. Teams is built for shared work, permissions, and organization-wide chart consistency. Enterprise is for larger teams that need custom visuals, SSO, audit logs, and volume pricing.
| Plan | Best for | Monthly price | Annual price shown | Main included notes | Best action |
|---|---|---|---|---|---|
| Free | Testing the editor | $0 | $0 | Charts with watermark. Good for checking chart types and basic workflow before paying. | Create account |
| Professional | Solo users, consultants, founders, marketers | $19/month after trial | $15/month, $180 billed annually after trial | 120+ chart types, layout and theme customization, external dataset links, and no watermark on paid work. | Start free trial |
| Teams | Departments and shared presentation workflows | From $69/month for 5 seats after trial | From $59/month for 5 seats, $708 billed annually after trial | Roles, permissions, team sharing, project folders, and advanced customization options. | Start free trial |
| Enterprise | Larger organizations with admin and security needs | Contact sales | Contact sales | Custom visualizations, SSO integration, audit log, volume pricing, and broader admin control. | Contact sales |
Mobile note: swipe the pricing table sideways to compare all columns.
Pricing can change. Check the final Vizzlo checkout page before subscribing, especially if your account uses a different billing cycle, currency, tax setting, team size, or promotional condition.
Which Vizzlo Plan Should You Pick?
Start with the plan that matches how your charts will be used. Testing, client-facing work, team reporting, and enterprise security are four different buying situations.
Professional Annual
Best for solo users who create polished presentation charts for client decks, reports, business reviews, investor updates, or public-facing slides.
Use this if you only want to test the editor, explore chart types, and do not mind watermark output during evaluation.
Use this if you work alone and need clean, polished charts for client decks, reports, presentations, or internal business reviews.
Use this if multiple people need shared folders, roles, permissions, team access, and consistent visual standards across departments.
Use this if your company needs SSO, audit logs, custom visualizations, centralized billing, security review, and larger account support.
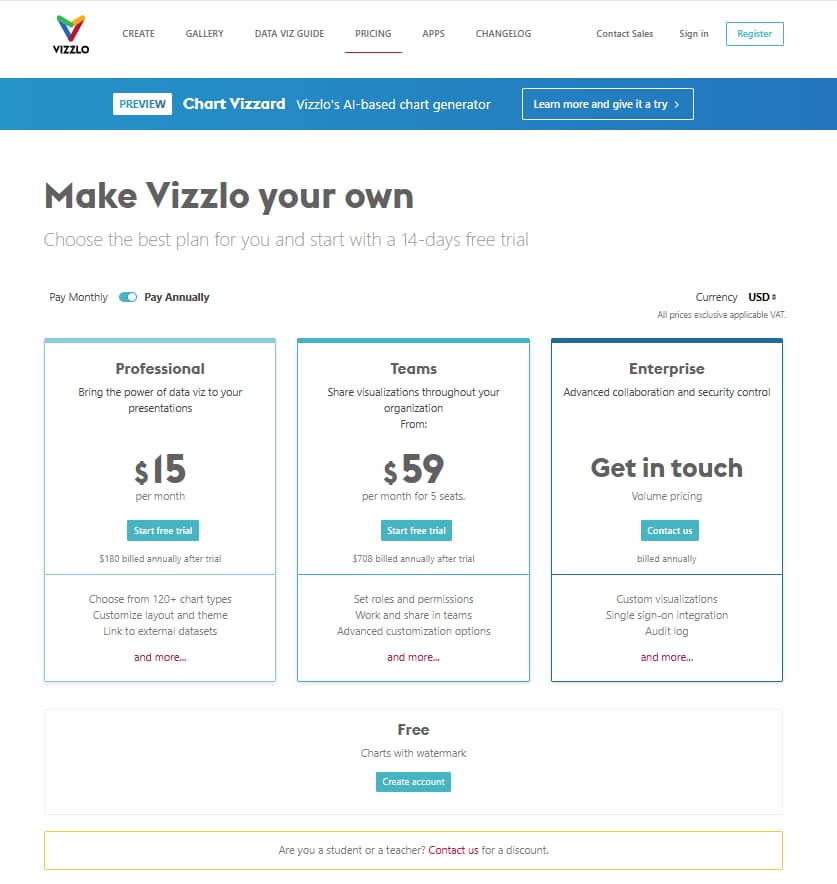
Vizzlo pricing includes Professional, Teams, Enterprise, and Free plans, with annual pricing shown for Professional and Teams.
Key Features That Matter in Real Work
Vizzlo makes the most sense when charts need to leave the spreadsheet and survive inside a presentation. That sounds basic, but many teams still build charts in one tool, screenshot them, paste them into slides, resize them manually, and lose consistency across decks.
Business chart library
Vizzlo gives users a wide set of chart and business graphic types, including standard charts, timelines, roadmaps, Gantt-style visuals, funnels, matrices, and other presentation-friendly diagrams.
Presentation-first output
Vizzlo fits users who work in PowerPoint, Google Slides, browser, or desktop apps. That matters when the final deliverable is a deck, not a dashboard.
Layout and theme control
Paid plans support cleaner control over layout, colors, themes, and presentation styling. This helps teams keep charts consistent across reports and client-facing materials.
External dataset links
Professional users can link to external datasets. For recurring reports, this is useful because the chart can be updated without rebuilding the whole visual from scratch.
Team collaboration
Teams adds roles, permissions, shared folders, and team-based chart workflows. This is useful when several people create or update visuals for the same organization.
Security and admin options
Enterprise adds controls such as single sign-on, audit logs, custom visualizations, centralized billing, and admin features for larger organizations.
Vizzlo AI Chart Vizzard: What It Actually Helps With
Vizzlo includes Chart Vizzard, an AI-based chart generator designed to help users start a chart from a prompt, example, idea, or data explanation. The useful part is not just speed. The useful part is that the result can move into Vizzlo’s chart editor, where users can refine labels, chart structure, styling, and presentation context before using it in a deck.
| Prompt to chart | Editable output | Slides workflow | Best use case |
|---|---|---|---|
| Start with a clear instructionDescribe the data, goal, chart idea, audience, or business question so AI can create a first visual direction. | Refine inside VizzloOpen the generated result in Vizzlo’s editor and adjust labels, chart structure, colors, layout, and context manually. | Move into presentation workUse the chart in browser, PowerPoint, or Google Slides workflows after review and final formatting. | Use it for first draftsHelpful for chart ideation, report visuals, rough concepts, timelines, comparisons, and cleaner business graphics. |
Use AI for speed, then review the chart like an editor.
Chart Vizzard is useful for escaping the blank canvas, but the final chart still needs human review before it appears in a client deck, team report, or investor update.
Use it to draft a chart direction, test a visual structure, turn messy ideas into a cleaner starting point, or create a fast first version before manual refinement.
- Check data accuracy and labels.
- Confirm the chart type explains the point.
- Review colors, legends, and context.
- Make sure the final visual fits the slide or report.
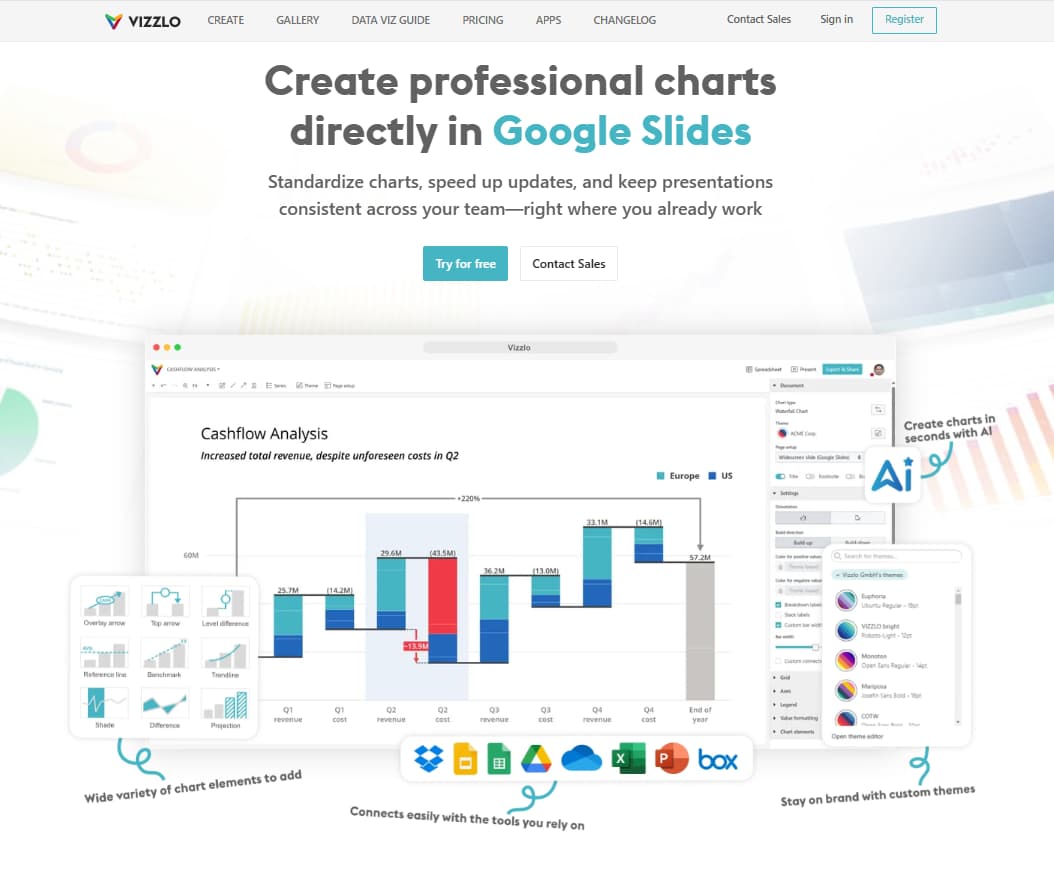
Vizzlo can be used inside Google Slides to create and update professional charts directly in presentation workflows.
Vizzlo vs Competitors
Vizzlo should not be judged like a general design app or a full analytics dashboard. It sits between spreadsheets, presentation tools, and business chart makers. That middle lane is useful when users need charts that look clean enough for a client deck without turning chart formatting into a separate design project.
| Tool | Best fit | Chart depth | Presentation workflow | Team controls | Where it may fall short |
|---|---|---|---|---|---|
| Vizzlo | Presentation-ready business charts | Strong for chart variety, timelines, diagrams, and business visuals | Browser, PowerPoint, Google Slides, desktop apps | Teams and Enterprise plans | Not a full BI dashboard platform |
| Canva | General visual design and social content | Good for simple charts | Good for broad design layouts | Team plans available | Less focused on advanced business chart types |
| Beautiful.ai | Slide design and deck creation | Good for presentation visuals | Strong for building decks | Team plans available | Less chart-specific than Vizzlo |
| Excel / Google Sheets | Data entry and basic analysis | Good for standard charts | Needs manual slide cleanup | File sharing, limited visual governance | Charts often need formatting before client use |
| Tableau / Power BI | Analytics dashboards and internal reporting systems | Deep analytics charting | Not slide-first | Strong enterprise admin | More setup than many presentation chart tasks need |
Mobile note: swipe the comparison table sideways to see all tool columns.
Which Tool Should You Choose?
Vizzlo wins when the job is creating clean business charts for presentations. Other tools make sense when the output is design, spreadsheet analysis, or a full analytics dashboard.
Pros & Cons
Pros
- Strong fit for presentation charts, reports, proposals, timelines, and business diagrams.
- Free plan lets users test the editor before choosing a paid plan.
- Professional plan works well for solo consultants, marketers, analysts, and founders.
- Teams plan adds roles, permissions, sharing, and organization-level visual consistency.
- PowerPoint and Google Slides support fit the way many teams actually present work.
- Enterprise plan covers SSO, audit log, custom visualizations, and admin needs.
Cons
- Free plan exports include watermark, so polished work usually needs a paid plan.
- Teams pricing starts from 5 seats, which may be more than very small teams need.
- Not the best choice for live BI dashboards or deep analytics systems.
- General design tools may be better if you need social graphics, posters, or broad creative assets.
- Enterprise pricing is not public, so larger buyers need to contact sales.
Who Should Use Vizzlo?
Use Vizzlo if...
- You create charts for business decks, reports, proposals, client updates, or board materials.
- You need more visual options than basic spreadsheet charts provide.
- You work with timelines, roadmaps, Gantt-style visuals, funnels, matrices, or presentation diagrams.
- Your team needs consistent chart styling across many presentations.
- You want a tool that fits PowerPoint and Google Slides workflows.
Skip Vizzlo if...
- You only create one basic chart every few months.
- You need a live dashboard connected to many data sources.
- You mainly want broad design assets for social media or ads.
- You cannot use watermark output and do not plan to upgrade.
- Your team is happy with raw spreadsheet charts and does not care about visual consistency.
Final Verdict: Is Vizzlo Worth It?
Vizzlo is worth trying if charts are a regular part of your presentations. It is not trying to replace BI platforms. It is better judged as a business chart and presentation graphics tool, and in that lane it makes sense.
The Professional plan is the most practical pick for solo users who create client decks, reports, marketing summaries, investor updates, or internal business visuals. The Teams plan is better when several people need shared folders, permissions, and consistent chart styling. The Free plan is mostly a testing lane because watermark output limits serious use.
Our editorial score is 8.9/10. Vizzlo earns that score because it solves a specific problem clearly: turning data and business ideas into clean charts for presentations. It loses points because it is not a full dashboard tool and very small teams may find the Teams seat structure heavier than needed.
Vizzlo FAQ
Does Vizzlo have a free plan?
Yes. Vizzlo has a Free plan for creating charts, but charts include a watermark. It is best used for testing the editor before choosing a paid plan.
How long is the Vizzlo free trial?
Vizzlo shows a 14-day free trial for paid plans. Always check the final signup screen for the current billing terms before starting.
How much does Vizzlo Professional cost?
Vizzlo Professional is shown at $19 per month with monthly billing. In the annual pricing view, Professional is shown at $15 per month, billed annually after the trial.
How much does Vizzlo Teams cost?
Vizzlo Teams is shown from $69 per month for 5 seats with monthly billing. In the annual pricing view, Teams is shown from $59 per month for 5 seats, billed annually after the trial.
Who is Vizzlo best for?
Vizzlo is best for consultants, marketers, analysts, founders, educators, project managers, and teams that need business charts for presentations, reports, and strategy documents.
Is Vizzlo better than Canva?
Vizzlo is better for focused business charts and presentation graphics. Canva is better for broader visual design, social graphics, and general marketing assets.
What is Vizzlo Chart Vizzard?
Chart Vizzard is Vizzlo’s AI-based chart generator. It helps users create a first chart draft from a prompt or idea, then continue refining the result inside Vizzlo’s chart editor.